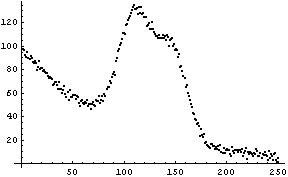
Нижеследующие примеры рассказывают как импортировать, подобрать наилучшию кривую для описания экспериментальных данных, построить график.
Use the command Import
to import
the data set. Mathematica automatically detects that the file is in table format and returns it as a list of lists.

Notice the semicolon at the end of the command. Without the semicolon
there for suppressing the output, a list of all 250 data points would be
printed into the notebook.
Mathematica provides the function ListPlot
for plotting experimental data.

